Amplicon Sequencing Pipeline
Version 4.6.0
Amplicon sequencing (ribosomal RNA gene amplification analysis) is a metagenomic pipeline. It is based on the established Quantitative Insights into Microbial Ecology (QIIME) procedure for amplicon-based metagenomics. It assembles read pairs using Fast Length Adjustment of Short Reads (FLASH), detects chimeras with UCHIME, and picks operational taxonomic units using VSEARCH. Operational taxonomic units are then aligned using PyNAST and clustered with FastTree. Standard diversity indices, taxonomical assignments, and ordinations are then calculated and reported graphically.
Besides QIIME Pipeline GenPipes also supports the DADA2 protocol, a relatively new processing workflow for recovering single-nucleotide resolved Amplicon Sequence Variants (ASVs) from amplicon data.
See Schema tab for the pipeline workflow.
Command
ampliconseq.py [-h] [--help] [-c CONFIG [CONFIG ...]] [-s STEPS]
               [-o OUTPUT_DIR] [-j {pbs,batch,daemon,slurm}] [-f]
               [--no-json] [--report] [--clean]
               [-l {debug,info,warning,error,critical}]
               [--sanity-check]
               [--container {wrapper, singularity} <IMAGE PATH>]
               [--genpipes_file GENPIPES_FILE]
               [-t {qiime, dada2 (default) }] [-d DESIGN] [-r READSETS] [-v]
Example Run
Use the following commands to execute Amplicon sequence pipeline:
ampliconseq.py -c $MUGQIC_PIPELINES_HOME/pipelines/ampliconseq/ampliconseq.base.ini $MUGQIC_PIPELINES_HOME/pipelines/common_ini/beluga.ini -r readset.ampliconseq.txt -t dada2 -s 1-32 -g ampliconseqCommands.sh

bash ampliconseqCommands.sh
Tip
Replace beluga.ini file name in the command above with the appropriate clustername.ini file located in the $MUGQIC_PIPELINES_HOME/pipelines/common_ini folder, depending upon the cluster where you are executing the pipeline. For e.g., narval.ini, cedar.ini, graham.ini or narval.ini.
Warning
While issuing the pipeline run command, use `-g GENPIPES_FILE` option (see example above) instead of using the ` > GENPIPES_FILE` option supported by GenPipes so far, as shown below:
[genpipes_seq_pipeline].py -t mugqic -c $MUGQIC_PIPELINES_HOME/pipelines/[genpipes_seq_pipeline]/[genpipes_seq_pipeline].base.ini $MUGQIC_PIPELINES_HOME/pipelines/common_ini/beluga.ini -r readset.[genpipes_seq_pipeline].txt -s 1-6 > [genpipes_seq_pipeline]_commands_mugqic.sh

bash [genpipes_seq_pipeline]_commands_mugqic.sh
` > scriptfile` should be considered deprecated and `-g scriptfile` option is recommended instead.
Please note that redirecting commands to a script `> genpipe_script.sh` is still supported for now. But going forward, this mechanism might be dropped in a future GenPipes release.
You can download the test dataset for this pipeline here.
Options
-t {qiime,dada2}, --type {qiime,dada2}

                          AmpliconSeq analysis type (default=dada2)
-d DESIGN, --design DESIGN

                          design file
-r READSETS, --readsets READSETS

                          readset file
-h show this help message and exit
--help show detailed description of pipeline and steps
-c CONFIG [CONFIG ...], --config CONFIG [CONFIG ...]

                          config INI-style list of files; config parameters
                          are overwritten based on files order
-s STEPS, --steps STEPS step range e.g. '1-5', '3,6,7', '2,4-8'
-o OUTPUT_DIR, --output-dir OUTPUT_DIR

                          output directory (default: current)
-j {pbs,batch,daemon,slurm}, --job-scheduler {pbs,batch,daemon,slurm}

                          job scheduler type (default: slurm)
-f, --force               force creation of jobs even if up to date (default:
                          false)
--no-json                 do not create JSON file per analysed sample to track
                          the analysis status (default: false i.e. JSON file
                          will be created)
--report                  create 'pandoc' command to merge all job markdown
                          report files in the given step range into HTML, if
                          they exist; if --report is set, --job-scheduler,
                          --force, --clean options and job up-to-date status
                          are ignored (default: false)
--clean                   create 'rm' commands for all job removable files in
                          the given step range, if they exist; if --clean is
                          set, --job-scheduler, --force options and job up-to-
                          date status are ignored (default: false)

                          Note: Do not use -g option with --clean, use '>' to redirect
                          the output of the --clean command option
-l {debug,info,warning,error,critical}, --log {debug,info,warning,error,critical}

                          log level (default: info)
--sanity-check            run the pipeline in `sanity check mode` to verify
                          all the input files needed for the pipeline to run
                          are available on the system (default: false)
--container {wrapper, singularity} <IMAGE PATH>

                          run pipeline inside a container providing a container
                          image path or accessible singularity hub path
-v, --version show the version information and exit
-g GENPIPES_FILE, --genpipes_file GENPIPES_FILE

                          Commands for running the pipeline are output to this
                          file pathname. The data specified to pipeline command
                          line is processed and pipeline run commands are
                          stored in GENPIPES_FILE, if this option is specified
                          . Otherwise, the output will be redirected to stdout
                          . This file can be used to actually "run the
                          GenPipes Pipeline"

                          Note: Do not use -g option with -clean. Use '>' to redirect
                          the output to a file when using -clean option.
QIIME
Figure below shows the schema of the amplicon sequencing protocol - QIIME Pipeline.
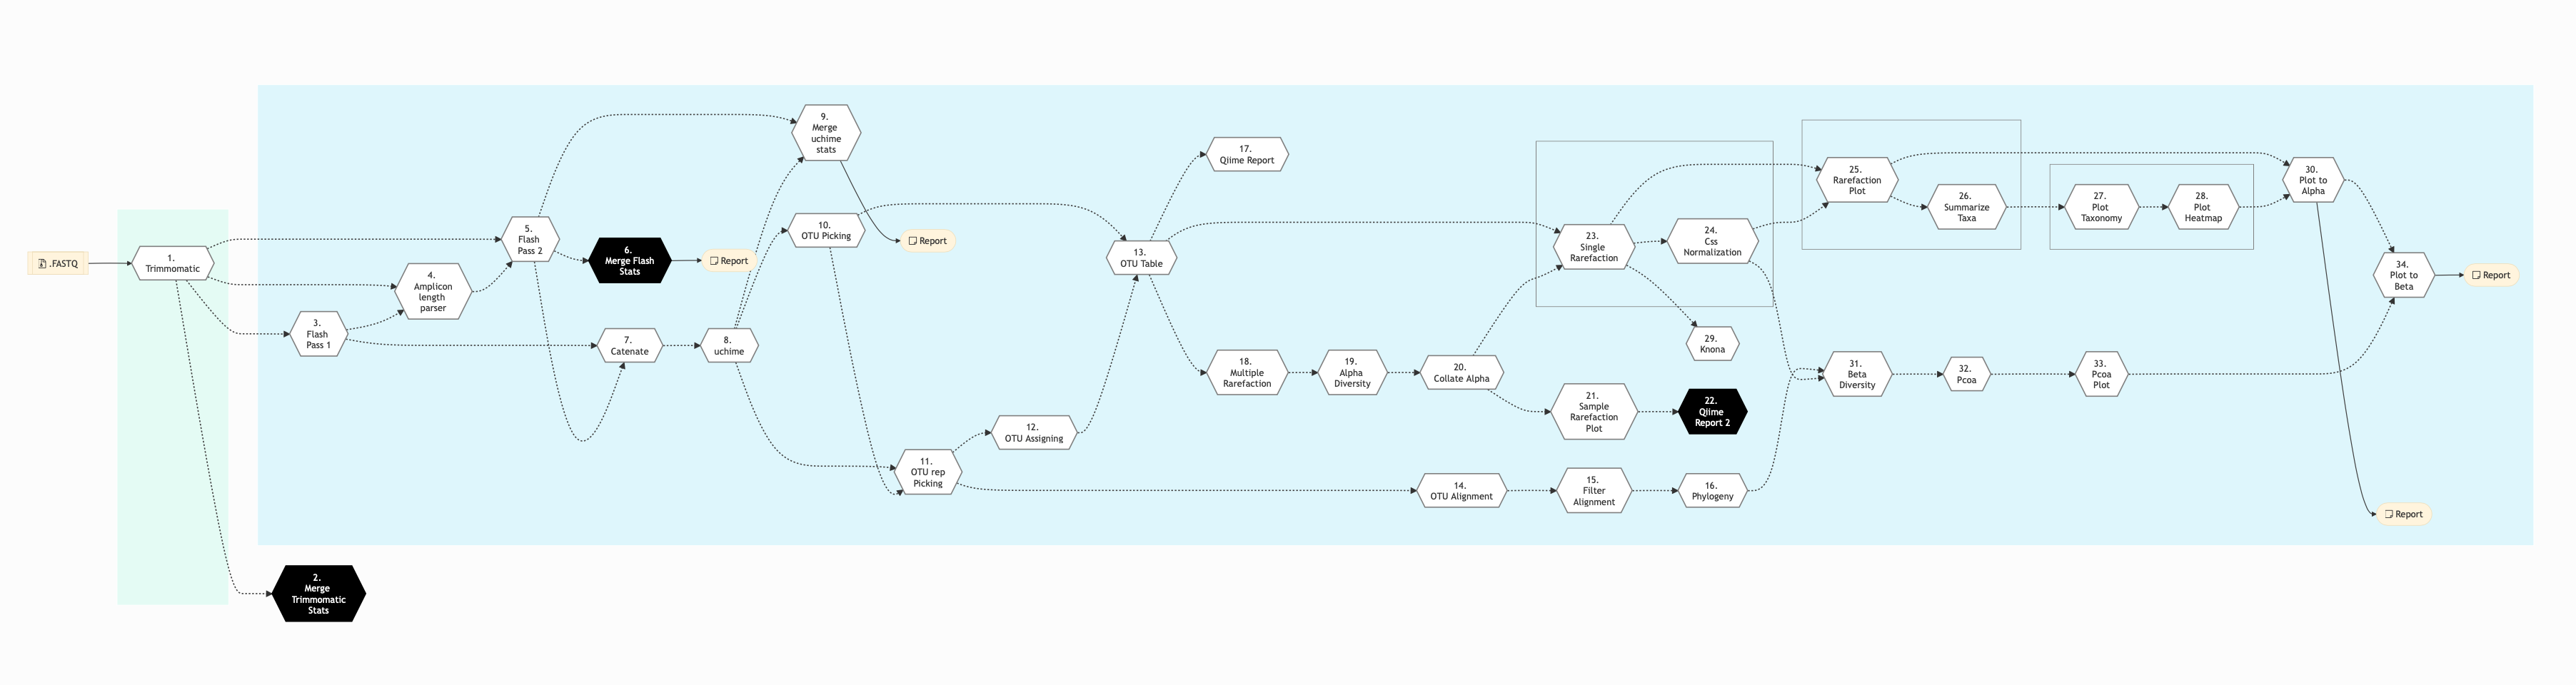
Figure: Schema of QIIME Amplicon Sequencing protocol
Click for a high resolution image of Amplicon Sequencing Pipeline (qiime).
DADA2
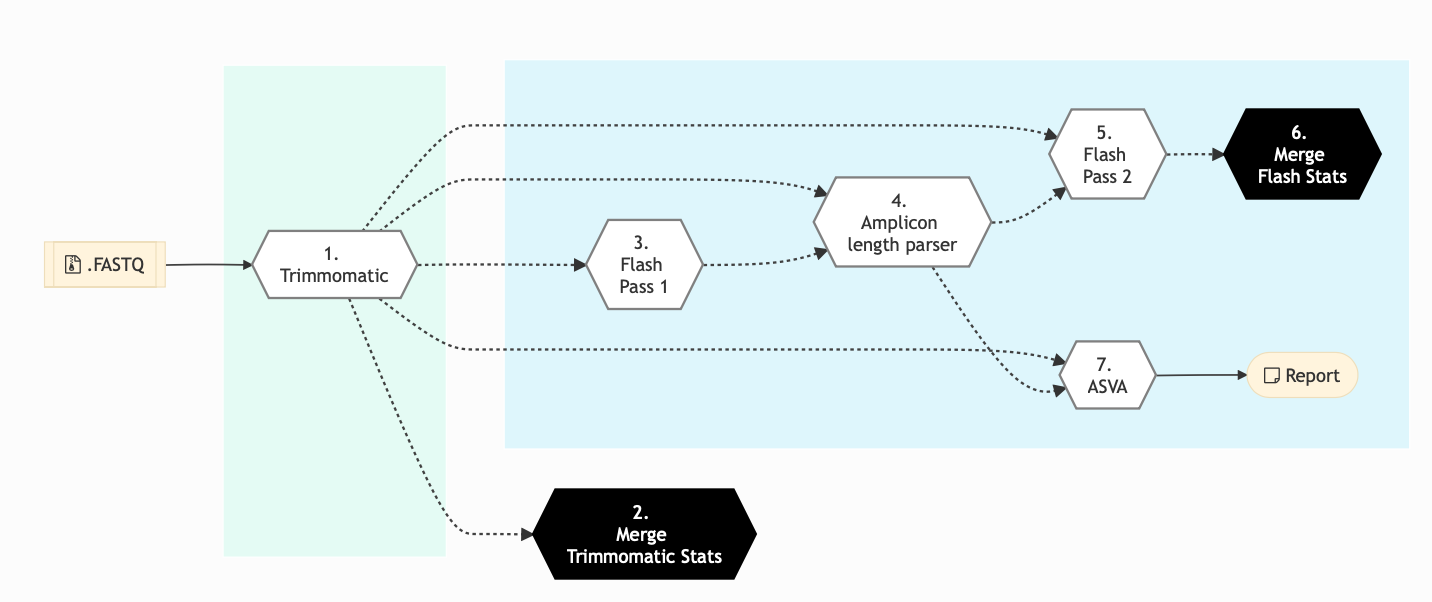
Figure: Schema of DADA2 Amplicon Sequencing protocol
Click for a high resolution image of Amplicon Sequencing Pipeline (dada2).
QIIME sequencing Steps |
DADA2 sequencing Steps |
|
|---|---|---|
Step Details
Following are the various steps that are part of GenPipes Amplicon Sequencing genomic analysis pipeline:
Trimmomatic16S
MiSeq raw reads adapter & primers trimming and basic QC is performed using Trimmomatic. If an adapter FASTA file is specified in the config file (section ‘trimmomatic’, param ‘adapter_fasta’), it is used first. Else, Adapter1, Adapter2, Primer1 and Primer2 columns from the readset file are used to create an adapter FASTA file, given then to Trimmomatic. Sequences are reversed-complemented and swapped.
This step takes as input files:
MiSeq paired-End FASTQ files from the readset file.
Merge Trimmomatic Stats
The trim statistics per readset are merged in this step.
Flash Pass 1
Perform first pass of FLASH. FLASH is a fast computational tool to extend the length of short reads by overlapping paired-end reads from fragment libraries that are sufficiently short.
Flash Pass 2
Perform second pass of FLASH to find the correct overlap between paired-end reads and extend the reads by stitching them together.
Amplicon Length Parser
In this step, we look at FLASH output to set amplicon lengths input for DADA2. As minimum eligible length, a given length needs to have at least 1% of the total number of amplicons.
Merge Flash Stats
The paired end merge statistics per readset are merged in this step.
Catenate
This step catenates all the reads in one file for further analysis. As input, it takes the merged FASTQ files from the previous FLASH step.
UCHIME
This step takes catenated FASTA file from the previous Catenate step and uses it for reference based chimera detection using VSearch tool.
Merge UCHIME Stats
The chimeric sequences filtered out statistics per readset are merged at this step.
Operational Taxonomic Unit (OTU) Picking
This step takes catenated FASTA file from the previous Catenate step as input. The OTU picking step (de novo & close_ref) assigns similar sequences to operational taxonomic units (OTUs) by clustering sequences based on a user-defined similarity threshold. Method per default uses the following tools:
OTU Representative Picking
After picking OTUs, this step pick a representative sequence for each OTU. This step takes as input files:
OTU file from previous step
Catenated and filtered FASTA file from filter_chimeras step.
OTU Assigning
Given a set of OTUs, this step attempts to assign the taxonomy of each OTU using Uclust algorithm. As input, it takes OTU representative sequence file from the previous step.
OTU Table
This step make a consensus OTU table in biom format. It tabulates the number of times an OTU is found in each sample, and adds the taxonomic predictions for each OTU.
This step takes as input files:
OTU picking file.
Taxonomy assignment for each OTU from the previous step.
OTU Alignment
OTU Alignment uses OTU representative sequence file as input and aligns the OTU representative sequence using PyNAST tool.
Filter Alignment
This step takes the alignment sequence file as input and filters it by removing positions that are gaps in every sequence.
Phylogeny
This step uses filtered alignment sequence file from previous step and builds a phylogenetic tree from a multiple sequence alignment using FastTree algorithm.
QIIME Report
In this step, the first part of the report for taxonomic affiliation is created.
Multiple Rarefaction
This is the first of the four steps (1/4) for rarefaction plot. It takes OTU non-rarefied table in biom format as input. It rarefies OTU table by random sampling (without replacement) at different depth in order to perform rarefaction analysis. You need to provide the minimum/maximum number of sequences per samples and the size of each steps between the min/max of seqs/sample.
Alpha Diversity
This is the second of the four steps (2/4) for rarefaction plot. It takes as input, multiple OUT rarefied table in biom format from the previous step and calculates alpha diversity on each sample using a variety of alpha diversity metrics (chao1, shannon, observed OTUs).
Collate Alpha
This is the third of the four steps (3/4) for rarefaction plot. It merges all the alpha diversity computed in the previous step.
Sample Rarefaction Plot
This is the fourth and last of the four steps (4/4) for rarefaction plot. Here, rarefaction curve for each sample is plotted.
QIIME Report 2
In this step, the second part of the report for taxonomic affiliation is created.
Single Rarefaction
Single rarefaction takes OTU table in biom format as input. This step is recommended. It subsamples (rarefy) all the samples to an equal number of sequences for further comparison. You have to provide the number of sequences to subsample per sample in the configuration file (single_rarefaction_depth).
CSS Normalization
CSS Normalization takes OTU table in biom format as input. This is the alternative method for normalization to rarefaction. The CSS Matrix normalization step is recommended.
Rarefaction Plot
In this step, rarefaction curve for each sample is plotted on the same plot.
Summarize Taxonomy
This is the first of three (1/3) steps for taxonomic affiliation plot. If available, it takes OTU rarefied table in biom format as input. Otherwise, it takes OTU non-rarefied table in biom format. It summarizes information of taxonomic groups within each sample at different taxonomic level.
Plot Taxonomy
This is the second of three (2/3) steps for taxonomic affiliation plot. It takes summarization information from the previous step as input and makes taxonomy summary bar plot based on taxonomy assignment.
Plot Heatmap
This is the third and last of three (3/3) steps for taxonomic affiliation plot. It takes summarized information from previous step and makes heatmap at phylum level.
Krona
This step plots the Krona chart for taxonomic affiliation.
Plot to Alpha
This step generates the first part of the final report for Amplicon sequencing pipeline. The report displays results related to taxonomy, heatmap and alpha diversity.
Beta Diversity
This is the first of three (1/3) steps for 2D PCoA analysis plot.
It takes the following data as input files:
OTU rarefied table in biom format
Tree file
This step calculates beta diversity (pairwise sample dissimilarity) on OTU table. The OTU table has to be normalized. Only works with >= 4 samples
Principal Coordinate Analysis (PCoA analysis) is the second step of three (2/3) for PCoA plot. It takes the matrix produced in the previous step and computes coordinates for PCoA.
PCoA Plot
This is the last of three (3/3) steps for 2D PCoA analysis plot.
Plot to Beta
Here the last part of the final report for Amplicon sequencing pipeline is generated. The report displays results related to beta diversity PCoA plots.
Asva
This step checks for the design file (required for PCoA Plot)
Amplicon sequencing is a highly targeted gene sequencing approach used to analyze genetic variation in specific genomic regions. Amplicons are Polymerase Chain Reaction (PCR) products and the ultra-deep sequencing allows for efficient variant identification and characterization. Amplicon sequencing uses oligonucleotide probes that target and capture genomic regions of interest and then uses next-generation sequencing techniques.
Uses of Amplicon sequencing
Diagnostic microbiology utilizes amplicon-based profiling that allows to sequence selected amplicons such as regions encoding 16S rRNA that are used for species identification.
Discovery of rare somatic mutations in complex samples such as tumors mixed with germline DNA.
See More Information section below for details.
More information
For the latest implementation and usage details refer to Amplicon Sequencing implementation README.md file.