De-Novo RNA Sequencing Pipeline
RNA Sequencing is a technique that allows transcriptome studies based on high throughput next-generation gene sequencing (NGS). De novo sequencing refers to sequencing a novel genome where there is no reference sequence available for alignment. Sequence reads are assembled as contigs, and the coverage quality of de novo sequence data depends on the size and continuity of the contigs (i.e., the number of gaps in the data).
The standard MUGQIC RNA-Seq De Novo Assembly pipeline now supports two protocols. One uses the Trinity software suite to reconstruct transcriptomes from RNA-Seq data without using any reference genome or transcriptome. The other one uses Seq2Fun, a functional profiling tool which can directly perform functional quantification of RNA-seq reads without transcriptome de novo assembly.
Introduction
De-Novo RNASeq pipeline supports two protocols: Trinity and Seq2Fun.
Trinity Protocol (Default)
By default, the standard MUGQIC RNA-Seq De Novo Assembly pipeline uses the Trinity software suite to reconstruct transcriptomes from RNA-Seq data without using any reference genome or transcriptome.
De-Novo RNASeq pipeline using the Trinity protocol is adapted from the Trinity-Trinotate suggested workflow. It reconstructs transcripts from short reads, predicts proteins, and annotates, leveraging several databases. Quantification is computed using RSEM Tool, and differential expression is tested in a manner identical to the RNA-seq pipeline. We observed that the default parameters of the Trinity suite are very conservative, which could result in the loss of low-expressed but biologically relevant transcripts. To provide the most complete set of transcripts, the pipeline was designed with lower stringency during the assembly step in order to produce every possible transcript and not miss low-expressed messenger RNA. A stringent filtration step is included afterward in order to provide a set of transcripts that make sense biologically.
At first, reads are trimmed with Trimmomatic and normalized in order to reduce memory requirement and decrease assembly runtime, using the Trinity normalization utility inspired by the Diginorm algorithm.
Then, the transcriptome is assembled on normalized reads using the Trinity assembler. Trinity creates a Trinity.fasta file with a list of contigs representing the transcriptome isoforms. Those transcripts are grouped in components mostly representing genes. Components and transcripts are functionally annotated using the Trinotate suite. Gene abundance estimation for each sample has been performed using RSEM Tool (RNA-Seq by Expectation-Maximization). Differential gene expression analysis is performed using DESeq2 and edgeR Bioconductor packages.
The DESeq2 and edgeR methods model count data by a negative binomial distribution. The parameters of the distribution (mean and dispersion) are estimated from the data, i.e. from the read counts in the input files. Both methods compute a measure of read abundance, i.e. expression level (called base mean or mean of normalized counts in DESeq2, and concentration in edgeR) for each gene and apply a hypothesis test to each gene to evaluate differential expression. In particular, both methods determine a p-value and a log2 fold change (in expression level) for each gene. The Log2 FC of edgeR is reported in the differential gene results file, one file per design.
The log2fold change is the logarithm (to basis 2) of the fold change condition from condition A to B (mutation or treatment are the most common conditions). A “fold change” between conditions A and B at a gene or transcript is normally computed as the ratio at gene or transcript of the base mean of scaled counts for condition B to the base mean of scaled counts for condition A. Counts are scaled by a size factor in a step called normalization (if the counts of non-differentially expressed genes in one sample are, on average, twice as high as in another, the size factor for the first sample should be twice that of the other sample). Each column of the count table is then divided by the size factor for this column and the count values are brought to a common scale, making them comparable. See the edgeR vignette for additional information on normalization approaches used in the pipeline.
The differential gene analysis is followed by a Gene Ontology (GO) enrichment analysis. This analysis use the goseq approach. The goseq is based on the use of non-native GO terms resulting from trinotate annotations (see details in the section 5 of the corresponding vignette.
Thus a high quality contigs assembly is created by extracting all transcripts having a functional annotation as defined by trinotate, the Top BLASTX hit and TmHMM annotations are used by default.
Finally, different exploratory data analysis (EDA) techniques are applied to filtered isoforms expression levels. Main goals of expression level EDA are the detection of outliers, potential mislabeling, to explore the homogeneity of biological replicates and to appreciate the global effects of the different experimental variables.
An HTML summary report is automatically generated by the pipeline. This report contains description of the sequencing experiment as well as a detailed presentation of the pipeline steps and results. Various Quality Control (QC) summary statistics are included in the report and additional QC analysis is accessible for download directly through the report. The report includes also the main references of the software and methods used during the analysis, together with the full list of parameters that have been passed to the pipeline main script.
Seq2Fun protocol
RNA-seq is a powerful tool to answer many biological questions. While the majority of RNA-seq data has been collected and analyzed in model organisms, it is increasingly collected in non-model organisms such as many species of environmental and/or economical importance, to answer some very basic questions, such as which genes are up- and down- regulated, which pathways are changed under different conditions. In most cases, they either lack of genome references or do not have high-quality genome, which has posed great challenge for RNA-seq data analysis for these organisms.
Therefore, Seq2Fun, an ultra-fast, assembly-free, all-in-one tool has been developed based on a modern data structure full-text in minute space (FM) index and burrow wheeler transformation (BWT), to functional quantification of RNA-seq reads for non-model organisms without transcriptome assembly and genome references.
The Seq2fun protocol starts with merging FASTQ files with multiple readsets. Then Seq2fun use the FASTQ files to generate KO abundance table and several other files (such as seq2fun output files) that can be used to perform downstream analysis on NetworkAnalyst. A HTML report for seq2fun analysis is generated.
Additionally differential KO analysis is performed using DESeq2 method and edgeR R Bioconductor packages. on KO count files and result tables will be generated. Moreover, a pathway analysis using differential analysis is performed using fgsea.
For further information regarding Seq2Fun visit: https://www.seq2fun.ca/motivation.xhtml
Version
4.5.0
For the latest implementation and usage details refer to RNA Sequencing implementation README file file.
Usage
usage: rnaseq_denovo_assembly.py [-h] [--help] [-c CONFIG [CONFIG ...]]
                               [-s STEPS] [-o OUTPUT_DIR]
                               [-j {pbs,batch,daemon,slurm}] [-f]
                               [--no-json] [--report] [--clean]
                               [-l {debug,info,warning,error,critical}]
                               [--sanity-check]
                               [--container {wrapper, singularity} <IMAGE PATH>]
                               [--genpipes_file GENPIPES_FILE]
                               [-d DESIGN] [-t {trinity (default), seq2fun}]
                               [-r READSETS] [-v]
Optional Arguments
-t {trinity, seq2fun}, --type {trinity, seq2fun}
                          Type of RNA-seq Denovo assembly protocol (default=trinity)
-d DESIGN, --design DESIGN

                          design file
-r READSETS, --readsets READSETS

                          readset file
-h show this help message and exit
--help show detailed description of pipeline and steps
-c CONFIG [CONFIG ...], --config CONFIG [CONFIG ...]

                          config INI-style list of files; config parameters
                          are overwritten based on files order
-s STEPS, --steps STEPS step range e.g. '1-5', '3,6,7', '2,4-8'
-o OUTPUT_DIR, --output-dir OUTPUT_DIR

                          output directory (default: current)
-j {pbs,batch,daemon,slurm}, --job-scheduler {pbs,batch,daemon,slurm}

                          job scheduler type (default: slurm)
-f, --force               force creation of jobs even if up to date (default:
                          false)
--no-json                 do not create JSON file per analysed sample to track
                          the analysis status (default: false i.e. JSON file
                          will be created)
--report                  create 'pandoc' command to merge all job markdown
                          report files in the given step range into HTML, if
                          they exist; if --report is set, --job-scheduler,
                          --force, --clean options and job up-to-date status
                          are ignored (default: false)
--clean                   create 'rm' commands for all job removable files in
                          the given step range, if they exist; if --clean is
                          set, --job-scheduler, --force options and job up-to-
                          date status are ignored (default: false)

                          Note: Do not use -g option with --clean, use '>' to redirect
                          the output of the --clean command option
-l {debug,info,warning,error,critical}, --log {debug,info,warning,error,critical}

                          log level (default: info)
--sanity-check            run the pipeline in `sanity check mode` to verify
                          all the input files needed for the pipeline to run
                          are available on the system (default: false)
--container {wrapper, singularity} <IMAGE PATH>

                          run pipeline inside a container providing a container
                          image path or accessible singularity hub path
-v, --version show the version information and exit
-g GENPIPES_FILE, --genpipes_file GENPIPES_FILE

                          Commands for running the pipeline are output to this
                          file pathname. The data specified to pipeline command
                          line is processed and pipeline run commands are
                          stored in GENPIPES_FILE, if this option is specified
                          . Otherwise, the output will be redirected to stdout
                          . This file can be used to actually "run the
                          GenPipes Pipeline"

                          Note: Do not use -g option with -clean. Use '>' to redirect
                          the output to a file when using -clean option.
Example Run
Use the following commands to execute the De Novo sequencing pipeline:
rnaseq_denovo_assembly.py -c $MUGQIC_PIPELINES_HOME/pipelines/rnaseq_denovo_assembly/rnaseq_denovo_assembly.base.ini $MUGQIC_PIPELINES_HOME/pipelines/common_ini/beluga.ini -r readset.rnaseq.txt -d design.rnaseq.txt -s 1-23 -g rnaseqDeNovoCommands.sh

bash rnaseqDeNovoCommands.sh
Tip
Replace beluga.ini file name in the command above with the appropriate clustername.ini file located in the $MUGQIC_PIPELINES_HOME/pipelines/common_ini folder, depending upon the cluster where you are executing the pipeline. For e.g., narval.ini, cedar.ini, graham.ini or narval.ini.
Warning
While issuing the pipeline run command, use `-g GENPIPES_FILE` option (see example above) instead of using the ` > GENPIPES_FILE` option supported by GenPipes so far, as shown below:
[genpipes_seq_pipeline].py -t mugqic -c $MUGQIC_PIPELINES_HOME/pipelines/[genpipes_seq_pipeline]/[genpipes_seq_pipeline].base.ini $MUGQIC_PIPELINES_HOME/pipelines/common_ini/beluga.ini -r readset.[genpipes_seq_pipeline].txt -s 1-6 > [genpipes_seq_pipeline]_commands_mugqic.sh

bash [genpipes_seq_pipeline]_commands_mugqic.sh
` > scriptfile` should be considered deprecated and `-g scriptfile` option is recommended instead.
Please note that redirecting commands to a script `> genpipe_script.sh` is still supported for now. But going forward, this mechanism might be dropped in a future GenPipes release.
You can download the test dataset for this pipeline here.
Pipeline Schema
Figure below shows the schema of RNA Sequencing De Novo Assembly pipeline.
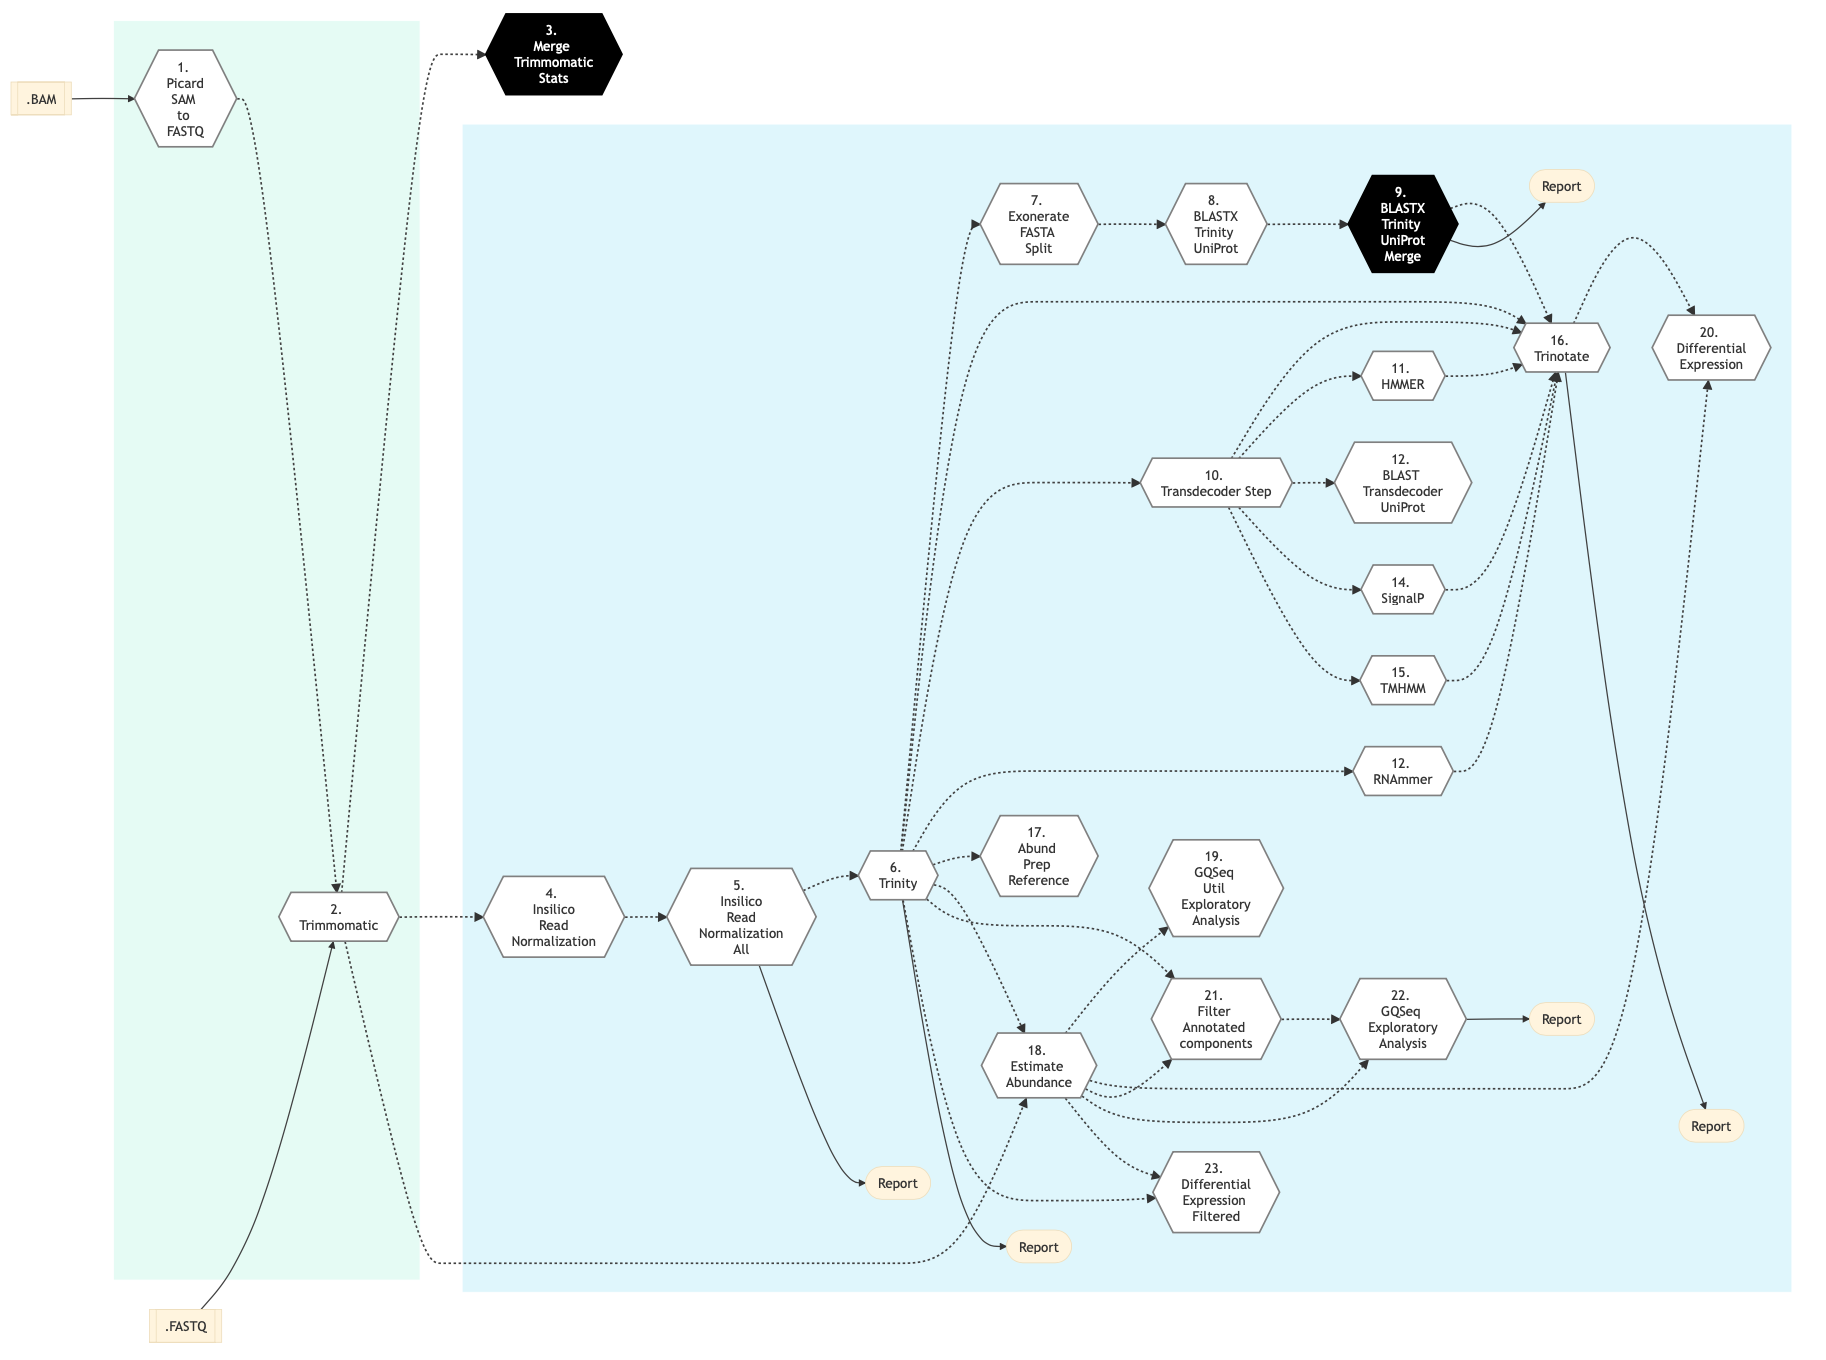
Figure: Schema of De Novo assembly RNA Sequencing protocol
Pipeline Steps
The table below lists various steps that constitute the RNA Sequencing De Novo Assembly.
Trinity Protocol Steps |
Seq2Fun Protocol Steps |
|
|---|---|---|
Step Details
Picard SAM to FastQ
Convert SAM/BAM files from the input readset file into FASTQ format if FASTQ files are not already specified in the readset file. Do nothing otherwise.
Trimmomatic
Raw reads quality trimming and removing of Illumina adapters is performed using Trimmomatic Tool. If an adapter FASTA file is specified in the config file (section ‘trimmomatic’, param ‘adapter_fasta’), it is used first. Else, ‘Adapter1’ and ‘Adapter2’ columns from the readset file are used to create an adapter FASTA file, given then to Trimmomatic. For PAIRED_END readsets, readset adapters are reversed-complemented and swapped, to match Trimmomatic Palindrome strategy. For SINGLE_END readsets, only Adapter1 is used and left unchanged.
This step takes as input files:
FASTQ files from the readset file if available
Else, FASTQ output files from previous picard_sam_to_fastq conversion of BAM files
Merge Trimmomatic Stats
The trim statistics per readset are merged at this step.
InSilico Read Normalization of Readsets
Normalize each readset, using the Trinity normalization utility.
InSilico Read Normalization (All)
Merge all normalized readsets together and normalize the result, using the Trinity normalization utility.
Trinity
Create a de novo assembly from normalized readsets using Trinity tool.
Exonerate FASTA Split
Split the Trinity assembly FASTA into chunks for further parallel BLAST annotations.
BLASTX Trinity UniProt
Annotate Trinity FASTA chunks with Swiss-Prot and UniRef databases using BLAST Tool.
BLASTX Trinity UniProt Merge
Merge blastx Swiss-Prot and UniRef chunks results.
TransDecoder Step
Identifies candidate coding regions within transcript sequences using Transdecoder.
HMMER Biosequence Analysis Step
Identifies protein domains using HMMER Biosequence Analysis
RNAmmer Method
Identify potential rRNA transcripts using RNAmmer Transcriptome.
BLAST Transdecoder UniProt
Search Transdecoder-predicted coding regions for sequence homologies on UniProt using BLASTP.
SignalP Method
Predict the presence of signal peptides and the location of their cleavage sites in proteins using SignalP.
TMHMM Method
This step involves prediction of transmembrane helices regions in proteins using TMHMM.
Trinotate
This step performs transcriptome functional annotation and analysis using Trinotate Annotation suite. ll functional annotation data is integrated into a SQLite database and a whole annotation report is created.
Align and estimate Abundance Prep Reference
Index Trinity FASTA file for further abundance estimation using Trinity align_and_estimate_abundance.pl utility.
Align and estimate Abundance
Estimate transcript abundance using RNA-Seq by Expectation-Maximization (RSEM) via Trinity align_and_estimate_abundance.pl utility.
Exploratory Analysis with gqSeqUtils R package
This step performs exploratory analysis using the gqSeqUtils R package.
Differential Expression
This step performs differential gene expression analysis using DESeq package and edgeR package. Merge the results of the analysis in a single csv file. Also,this pipeline step performs Gene Ontology analysis for RNA-Seq denovo Assembly using the Bioconductor’s R package goseq. It generates GO annotations for differential genes and isoforms expression analysis, based on associated GOTERMS generated by Trinotate Step earlier.
Filter Annotated Components
This step filters high quality contigs based on values in trinotate annotations. It also recreates a high quality contigs fasta file and run Assembly statistics using the gqSeqUtils R package.
Exploratory Analysis with subset of filtered transcripts
In this step, exploratory analysis is performed by the gqSeqUtils R package using a subset of filtered transcripts.
GOSEQ using filtered transcripts
In this step, differential expression and goseq analysis is performed based on filtered transcripts and genes.
Merge FASTQ
In this step FASTQ files are merged if the sample contains multiple readsets. One FASTQ file is crated for each sample.
Seq2Fun Step
For most non-model organisms, biological understanding of study outcomes is limited to protein-coding genes with functional annotations such as KEGG pathways or Gene Ontology or PANTHER classification system. Therefore, Seq2Fun databases focused on functionally annotated genes such as KOs largely meets the preferred needs of most scientists studying non-model organisms.
Note
We have stored number of pre-built databases by the Seq2Fun developers and the list can be found below.
Eukaryotes
Animals
Plants
Fungi
Protists
Mammals
Birds
Reptiles
Amphibians
Fishes
Arthropods
Nematodes
For further information see Seq2Fun Database details here <https://github.com/xia-lab/Seq2Fun#step-3-database-download>.
You can specify the required database in a custom.ini file by changing “group” key. The default group is “birds”.
These KOs in the database are KOs assigned to KEGG pathways and they are only a proportion of whole list of KOs.
All KOs include KOs not assigned to KEGG pathways.
The Seq2Fun step takes FASTQ files from the readset file as input if available. Otherwise, it uses FASTQ output files from previous Picard SAM to FastQ conversion of BAM files. The seq2fun analysis is performed in this step and generates output files including KO abundance table and KO mapped fastq files. These output files can be used for downstream analysis using Network Analyst web application. The interested comparisons should be specified using a design file (Format is similar to the default RNA-seq design file). Therefore, only pairwise comparisons are possible unlike the original Seq2Fun program.
Note
Treatment and controls will be added in the design file depending upon what input is provided, FASTQ files from the readset or FASTQ output files from the previous Picard SAM to FastQ conversion of BAM files step.
If you want to compare multiple groups you will have to break the comparison in to pairs.
For example, for 3 group comparison, the design file should be as follows:
Sample   A_vs_B   B_vs_C  A_vs_C
A1       1        0       1
B1       2        1       0
A2       1        0       1
B2       2        1       0
C1       0        2       2
C2       0        2       2
Seq2Fun analysis is performed using FASTQ files and it generates a sample table.
Differential Expression Seq2Fun
DESeq2 and edgeR are used to perform differential KO expression analysis in this step.
Pathway Enrichment Seq2Fun
In this step, a KEGG ortholog pathway analysis is performed using fgsea R package.
Current KEGG database used for the analysis was created on August, 2021. If you’d like to update the database, please follow below instructions to download the latest KEGG pathway database and create pathway list for the kegg_all key in the ini file and kegg.rds file. Download the latest KEGG database.
Instructions for download on Linux
wget http://rest.kegg.jp/list/pathway`
sed -i 's/path://g' pathway
mv pathway KEGG_all_pathways.txt
Instructions for download using R
library(data.table)
pathway_list <- fread("KEGG_all_pathways.txt", header =F)`
kegg_ko <- lapply(unique(pathway_list$mapID), fun)
names(kegg_ko) <- (pathway_list$mapID)
kegg <- lapply(kegg_ko, substring, 4)
saveRDS(kegg, "kegg.rds")
After downloading the database and performing the steps listed above, next, specify created files in a custom ini file.
user_pathway_list is a file with pathway that are interested with KEGG map id (only one column). You must specify the file path to the user_pathway_list in a custom.ini file.
More information
You can find more information about RNA Sequencing De Novo Assembly Pipeline in the following references:
Grabherr MG, Haas BJ, Yassour M, et al. Full-length transcriptome assembly from RNA-Seq data without a reference genome - Trinity-Trinotate.
Chin CS, Alexander DH, Marks P, et al. Non-hybrid, finished microbial genome assemblies from long-read SMRT sequencing data - suggested workflow.
Trinity RNA sequencing utilities Workshop Slides.