Viewing and Analyzing GenPipes Results
This document contains generic insights related to viewing and analyzing results obtained after running GenPipes Pipelines. It assumes that you are familiar with GenPipes Basics and have used one of the pipelines already as demonstrated in Using GenPipes.
Overview
If you are a new user of GenPipes and have successfully run it for the first time, you are likely to wonder, what is next? How can you determine whether all the jobs that were part of one of the GenPipes Pipelines were executed successfully? Where are the results located once the pipelines are run and what is the best way to view and analyze GenPipes results in general.
You can find answers to such questions here.
GenPipes Results
When a pipeline is run successfully, by default, the output is saved to the same location the pipeline was launched in the first place. This behavior can be changed by modifying the output directory when launching the pipeline using -o or –output-dir, for example:
rnaseq.py -o /PATH/TO/OUTPUT ... (other options)
For most pipelines, GenPipes creates an html report with most of the results in the pipeline. To create the report, you need to rerun the same command you ran to create the GenPipes commands, but add –report to it.
Refer to the ‘job_output’ directory. In that directory, you can find subdirectories that roughly correspond to each step in the pipeline, inside those are the log files. At the top, of the directory, there is a file that is named with the following convention:
job_output/PIPELINE_job_list_YEAR-MM-DDTHH.MM.SS
where, PIPELINE corresponds to the pipeline name and YEAR-MM-DDTHH.MM.SS to the date and time the pipeline was launched. This job list file in the job_output folder that can help you determine the status of each job and sub-jobs as well.
Note
This job_list file can be used to check the status of only those jobs that are scheduled using PBS and Slurm schedulers. Also, this feature is not supported when you run GenPipes in a container.
You can type in:
#$MUGQIC_PIPELINES_HOME/utils/log_report.pl job_output/{TECHNOLOGY}_job_list_{DATE}T{TIME}
For example:
#$MUGQIC_PIPELINES_HOME/utils/log_report.pl job_output/RnaSeq_job_list_2018-06-26T12.54.27
This command shown above, returns the status of each job. It outputs a summary file that includes the number of jobs that completed successfully, those that failed, and those that are still active/inactive.
You can save the output as a file and open it in Excel on your laptop. For each job, there is an exit code that indicates job status.
Exit Codes
Following are some of the common job exit codes:
0 - Exit code of 0 means that the pipeline ran without any issues
271 - This exit code typically means that there was insufficient RAM allocated and hence the job did not run successfully.
-11 - Exit code -11 indicates that the job was prematurely killed as it exceeded the allocated walltime - basically insufficient compute resources were assigned for the job.
Note
For every GenPipes Pipeline run, output is created in the default or specified location. However, please note that what is actually written in the output location varies significantly between each pipeline. Refer to GenPipes User Guide, Pipelines Reference section for details regarding the processing performed by different pipelines.
GenPipes Errors & Log Files
When launched, GenPipes creates a job_output folder where it stores the logs and errors from all the jobs. If errors occur, you need to look into the job_output folder for the log of the step that failed to see what it last printed before it shut down. This usually helps to understand what potentially happened. GenPipes also sends you an email once each job succeeds or fails. When a job finishes successfully, it will create a file with the extension .done.
GenPipes Logs are stored in the job_output folder under the appropriate folder for each step. For more details see GenPipes Error Logs.
Visualization and Analysis
GenPipes output results vary a lot depending upon each specific pipeline and the way it is configured to run. Also, the way results are analyzed is also dependent on the final objective of the analysis. For example, in case of visualizations, the results have to be imported to R or Python or some alternative visualization package.
Tools such as Integrative Genomics Viewer (IGV - Integrative Genomics Viewer), Genome Browser Gateway and several others are utilized for visualization of results. These tools vary from pipeline to pipeline.
Figure below demonstrates one such tool used for RNA Sequencing Analysis.
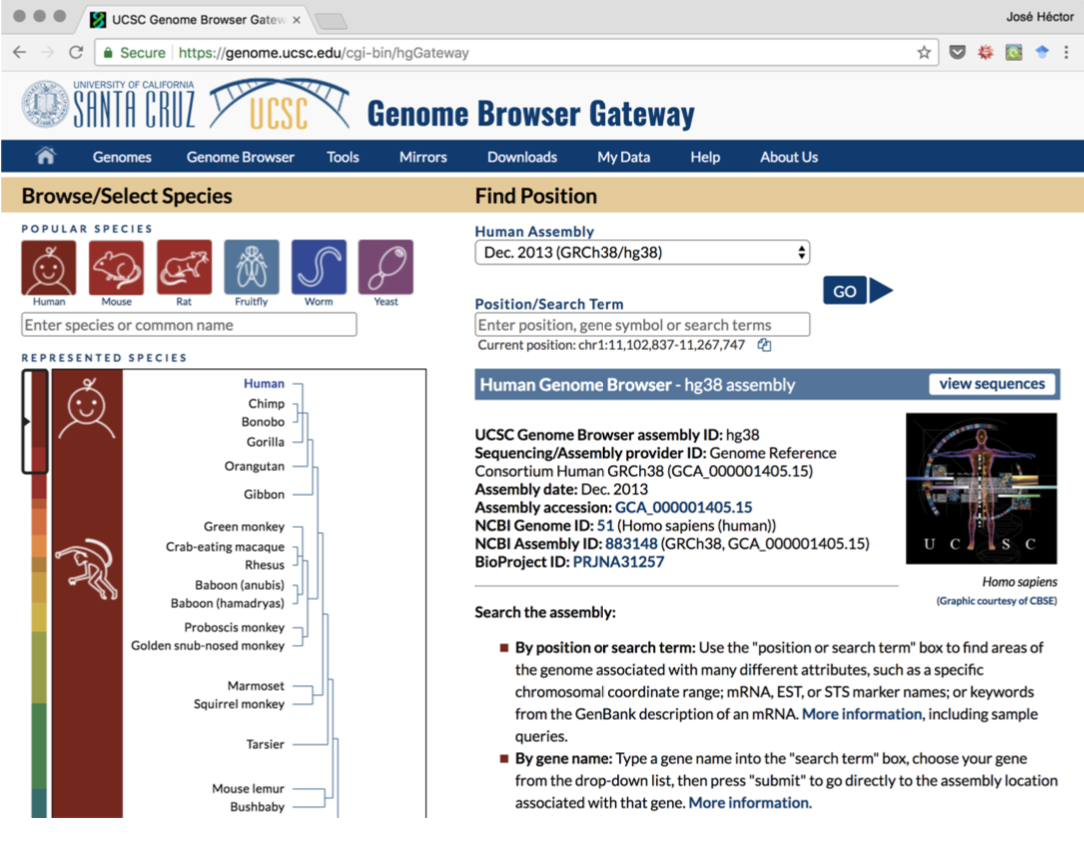
Figure: Genome Browser Gateway
The best way for new users and beginners is to use the –report option while running GenPipes Pipelines. Most pipelines support this and generate an html report that is saved under the report directory.
The report generated by using the –report flag summarize the most important results in the pipeline, while providing convenient links to the locations of important output files. More advanced users can use those output files to generate their own visualizations or further analyze results using their own methods.
As mentioned earlier, visualization of results varies from pipeline to pipeline. As a reference, you can see RNA Sequencing Analysis Visualization of results.
Figure below shows how the data is displayed once the alignment files are opened on IGV.
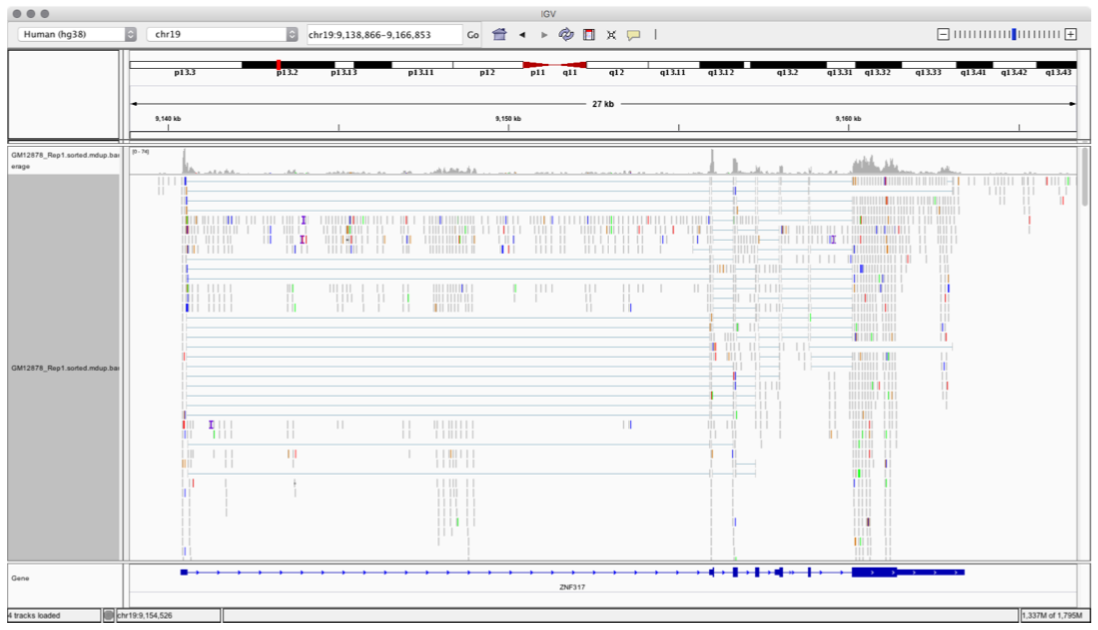
Figure: Data Alignment visualizer using IGV Tool
GenPipes Relaunch
If GenPipes fails, for any reason, you can recreate the commands and relaunch them. When recreating the commands, GenPipes can detect jobs that have completed successfully and will not rerun them. That being said, unless you understand why a job failed and fix it, relaunched jobs might fail with the same error.
GenPipes Clean
GenPipes stores some temporary files that are useful to shorten potential reruns. To delete all these files, you can run the GenPipes command with –clean. This will delete a lot of files that were marked by GenPipe developers as “removable”. If you are interested in temporary files, avoid the –clean command.
Tracking GenPipes Environment Parameters for quoting in Publications
In order to keep track of all parameters used, GenPipes creates a final .config.trace.ini file each time it is run. It is a good idea to keep a copy of that file in order to keep track of software versions used when publishing your paper or publication.